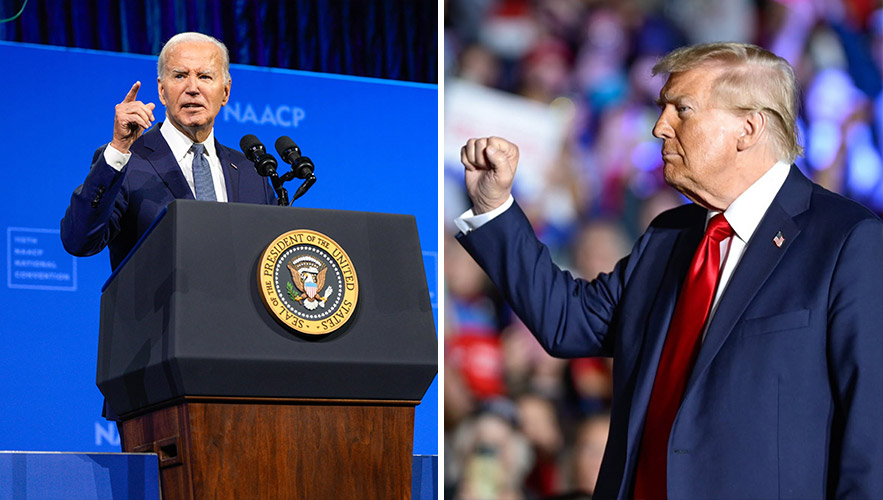
The gross federal debt rose by roughly $8.4 trillion while Joe Biden was president, but that does not make him an $8.4 trillion “spending president.” Donald Trump’s two terms combined now show a larger raw increase, and the comparison changes depending on which debt measure is used.

The United States crossed a new fiscal threshold in August 2026. Treasury data released Aug. 19 showed total public debt outstanding at about $40.05 trillion, including roughly $32.27 trillion held by the public and $7.78 trillion in intragovernmental holdings.
That milestone has revived a familiar political exercise: ranking presidents by how much debt accumulated during their time in office. On that narrow measure, Biden’s four years produced an increase of about $8.4 trillion. Trump’s first term added about $7.8 trillion, and his second term had added roughly $3.8 trillion by the $40 trillion milestone, putting his two terms together at about $11.6 trillion. Barack Obama’s eight years added about $9.3 trillion.
What the Treasury numbers show
The simplest calculation compares total public debt outstanding near the start and end of each presidency. Obama entered office with debt around $10.63 trillion and left with roughly $19.95 trillion, an increase of about $9.32 trillion. Trump’s first term took the figure from about $19.95 trillion to $27.75 trillion, or about $7.8 trillion. Biden then left office with gross debt around $36.2 trillion, producing an increase of roughly $8.4 trillion during his four years.
When Trump returned to office in January 2025, the debt was about $36.22 trillion. By the time the national total crossed $40 trillion in August 2026, another roughly $3.83 trillion had accumulated. Combining Trump’s first and still unfinished second terms yields about $11.6 trillion, more than either Obama or Biden on this raw dollar measure.
But that is not the same thing as a definitive ranking of the “biggest spending presidents.” It is a ranking of how much gross debt rose over selected presidential windows. Calling Biden “third” only works under a comparison in which Trump’s two terms are combined and Obama is second. It is not a universal all presidents ranking.
Debt added is not spending
The national debt rises when the federal government runs deficits and must borrow to finance the gap between revenues and outlays, along with other financing needs. Spending is therefore only one side of the equation. Tax cuts, weaker than expected revenue, emergency programs, economic downturns and the interest cost of previously accumulated debt can all increase borrowing.
That distinction matters because presidents do not write the federal budget alone. Congress passes tax and spending legislation, while presidents sign or veto bills and direct the executive branch within authority Congress has granted. Large parts of the budget also operate under standing law rather than a new annual presidential decision.
Even the phrase “debt added under a president” can imply more control than the office actually has. A president inherits tax law, benefit formulas, prior appropriations, existing debt and the interest rates at which that debt must be refinanced. The pandemic, for example, drove extraordinary bipartisan borrowing during both the Trump and Biden presidencies. Reuters estimated that roughly one third of the debt accumulated since 2017 was connected to pandemic era borrowing.
Biden’s policy score is different
A separate approach asks not how much debt happened to rise while Biden was in office, but how much projected borrowing resulted from legislation and executive actions approved during his presidency.
The nonpartisan Committee for a Responsible Federal Budget estimated in April 2025 that Biden approved about $4.68 trillion in net new debt over 10 year budget windows. Its calculation included roughly $6.6 trillion of deficit increasing actions and about $1.9 trillion of deficit reducing actions, using budget scores available when policies were enacted.
The largest additions in CRFB’s tally included about $2.06 trillion for the American Rescue Plan, $1.61 trillion from fiscal 2022 through 2024 appropriations, $520 billion for the PACT Act and $440 billion for the bipartisan infrastructure law. The group also attributed about $620 billion to student debt actions. Offsetting savings included roughly $1.53 trillion from the Fiscal Responsibility Act and about $250 billion from the Inflation Reduction Act.
That $4.68 trillion figure and the roughly $8.4 trillion increase in gross debt are measuring different things. The first tries to isolate the projected fiscal effect of new policy decisions. The second records the change in the Treasury’s total debt balance while Biden occupied the White House. They should not be presented as competing estimates of the same quantity.
Trump’s second term is unfinished
Trump’s combined raw debt total is already larger partly because it covers more time than Biden’s single four year term. His first term added about $7.8 trillion, and another roughly $3.8 trillion had been added by August 2026 after he returned to office.
Policy scoring also shows why the second term matters independently of the raw Treasury balance. The Congressional Budget Office estimated that the 2025 reconciliation law, Public Law 119-21, would increase deficits by about $3.4 trillion from 2025 through 2034 before accounting for macroeconomic feedback and additional debt service effects. CBO later estimated about $718 billion in extra debt service costs, bringing the cumulative deficit effect to roughly $4.1 trillion under that analysis.
A later CRFB dynamic analysis put the legislation’s debt impact at roughly $4.2 trillion through fiscal 2034 and $4.7 trillion through 2035 after economic feedback and debt service were included. Those are projections over a decade, not amounts already borrowed since Trump returned to office.
The $40 trillion mark matters
Gross debt is not the only measure economists watch. CBO generally emphasizes debt held by the public because it better captures federal borrowing from financial markets. At the $40 trillion milestone, about $32.27 trillion of the total was held by the public, while the remainder reflected intragovernmental holdings such as Treasury securities held by federal trust funds.
CBO’s February 2026 outlook projected debt held by the public at about 101% of gross domestic product in 2026, rising to 120% by 2036 under then current law. It projected a $1.9 trillion federal deficit for fiscal 2026 and deficits that remain large by historical standards throughout the coming decade.
Persistent deficits mean Treasury must keep issuing debt, while a larger debt stock makes the budget more sensitive to interest rates. When older low rate securities mature and are replaced with higher cost borrowing, the government’s interest bill can rise even without a new program being created.
Interest is now a major expense
CBO projected net federal interest outlays of more than $1 trillion in 2026. Its baseline put total defense outlays at roughly $918 billion for the year, meaning interest was already larger than defense under that projection. Net interest was expected to rise from about 3.3% of GDP in 2026 to 4.6% by 2036.
The bond market has reinforced that pressure. Long term Treasury yields climbed sharply in August amid concerns about inflation, heavy government borrowing and other demands for capital. The 10 year yield was around 4.7% and the 30 year yield above 5% during the recent selloff, levels that also feed into borrowing costs throughout the economy.
Treasury Secretary Scott Bessent played down the psychological significance of the milestone, saying, “There’s nothing magic about the $40 trillion number. We can grow our way out of that.” Economic growth can indeed reduce the debt burden relative to the size of the economy, but only if debt does not keep rising faster than the economy for prolonged periods.
The deficit is still widening
The latest monthly numbers show why the debt keeps climbing. Treasury reported a $432 billion deficit for July 2026, the largest July deficit on record. That figure was inflated by calendar shifts that moved some August benefit payments into July, but even after timing adjustments the monthly deficit was about $333 billion, up 18% from a year earlier.
Through the first 10 months of fiscal 2026, the deficit totaled about $1.799 trillion, already above the $1.775 trillion shortfall for all of fiscal 2025. July receipts were about $334 billion while outlays reached $766 billion. Net customs receipts were negative because the government was issuing refunds after the Supreme Court invalidated emergency tariffs imposed in 2025.
Those numbers underline why focusing only on one president’s spending misses the mechanics. The current deficit reflects tax policy, benefit programs, defense and other appropriations, tariff developments, economic conditions and the cost of servicing debt accumulated over many years.
No president owns the debt alone
Mandatory programs are central to the long run arithmetic. CBO projected about $4.5 trillion in mandatory outlays in 2026, including roughly $1.7 trillion for Social Security, about $1.1 trillion for Medicare and $708 billion for Medicaid. Total federal outlays were projected near $7.4 trillion.
Those programs grow largely because of demographics, benefit formulas and health care costs. That leaves elected officials with a problem that cannot be solved simply by cutting a handful of discretionary programs.
Margaret Spellings, president and CEO of the Bipartisan Policy Center, said the $40 trillion milestone reflects a “fundamental mismatch” between what federal programs spend and what the government collects. Her warning focused on the broader economic consequences of debt, including pressure on living costs, investment and other public priorities.
What the ranking really tells us
The defensible conclusion is narrower than the original “biggest spending president” label. Gross federal debt rose about $8.4 trillion during Biden’s single term. Trump’s first term added about $7.8 trillion, but his two terms combined had added roughly $11.6 trillion by August 2026. Obama’s eight year increase was about $9.3 trillion. On that specific nominal dollar measure and with Trump’s terms combined, Biden ranks behind Trump and Obama.
But nominal dollar comparisons naturally make recent presidencies look larger because the economy, federal budget and existing debt are all much bigger than they were decades ago. A percentage of debt comparison, a debt to GDP comparison or a policy attribution score can produce a different ordering and answer a different question.
That is why the $40 trillion milestone is more useful as a warning about the direction of federal finances than as a partisan scoreboard. Biden presided over one of the largest four year increases in gross debt. Trump’s combined total is already larger. Congress was deeply involved in both records. And with deficits still running near $2 trillion a year and interest costs above $1 trillion, the next president by president ranking is almost certain to feature even larger nominal numbers unless the underlying gap between federal revenue and spending materially narrows.
Leave a Reply